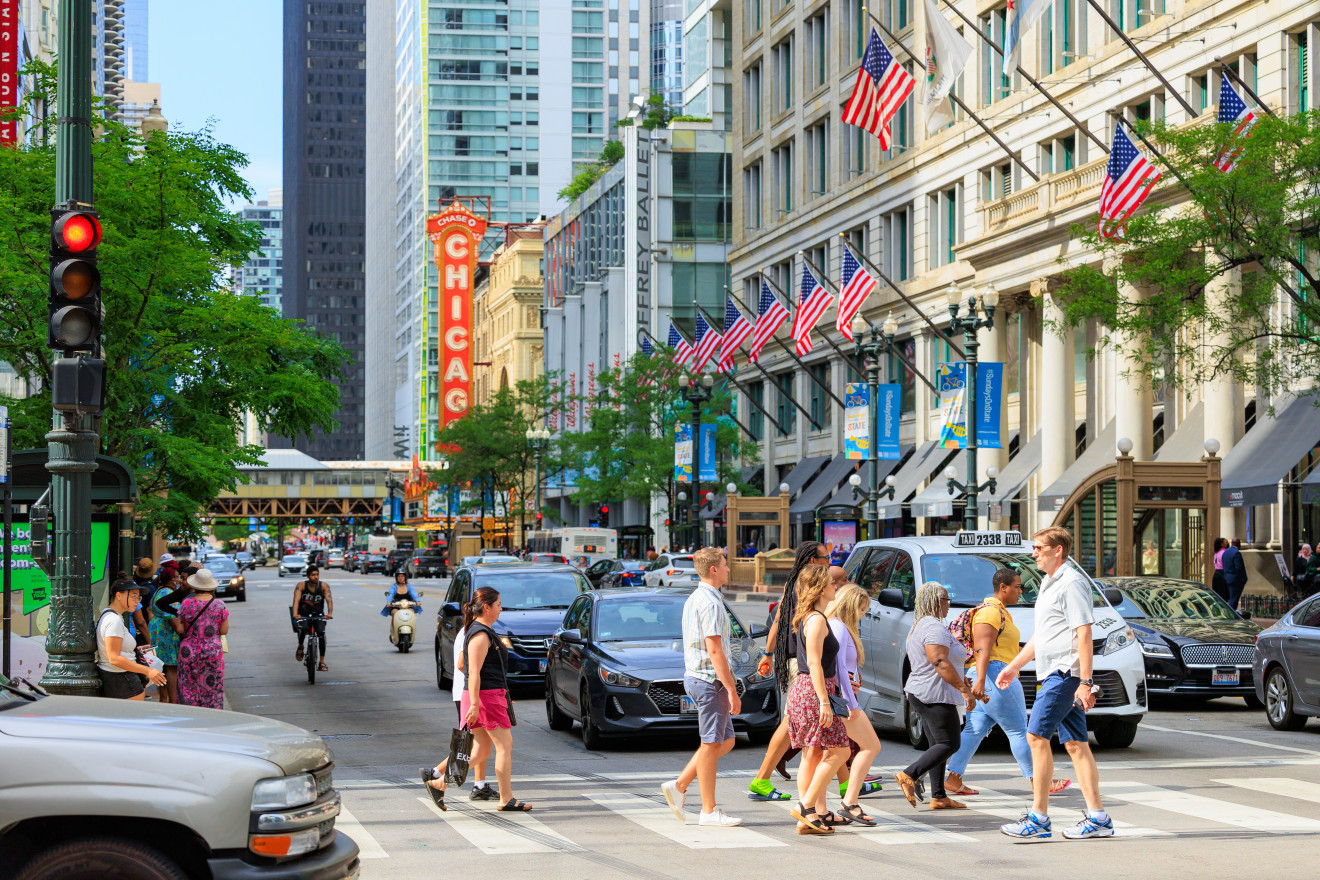
4 MIN READ – When it comes to crime in Chicago, the media often plays a large role in shaping the narrative of our city as unsafe, with the Loop/downtown area taking center stage in these conversations over the past couple of years. This type of media coverage often influences residents and visitors in their decision to enjoy our city for work or leisure in fear of their safety. Research findings from the Brookings Institution beg the question -- does the reality of downtown Chicago's crime truly match people's perception?
A recent study from The Brookings Institution finds that there's a misalignment between the perception of downtown crime versus the reality. The following excerpt from the study demonstrates that downtown crime accounts for a very small percentage of over-all city crime:
"Local data on property and violent crimes shows that in New York, Philadelphia, and Chicago, downtowns are some of the safest places to be. Interview respondents were not only afraid of violence downtown. They also spoke to a significant perceived increase in property crimes such as retail theft, motor vehicle thefts, and robberies. Nationally, evidence would seem to bear this out, as robberies increased by 5.5%, nonresidential burglaries by 11%, larcenies by 8%, and motor vehicle thefts by 21% nationwide between 2021 and 2022.
However, when we looked at hyperlocal data,[7] we identified three primary findings related to property and violent crime downtown that defied these larger trends:
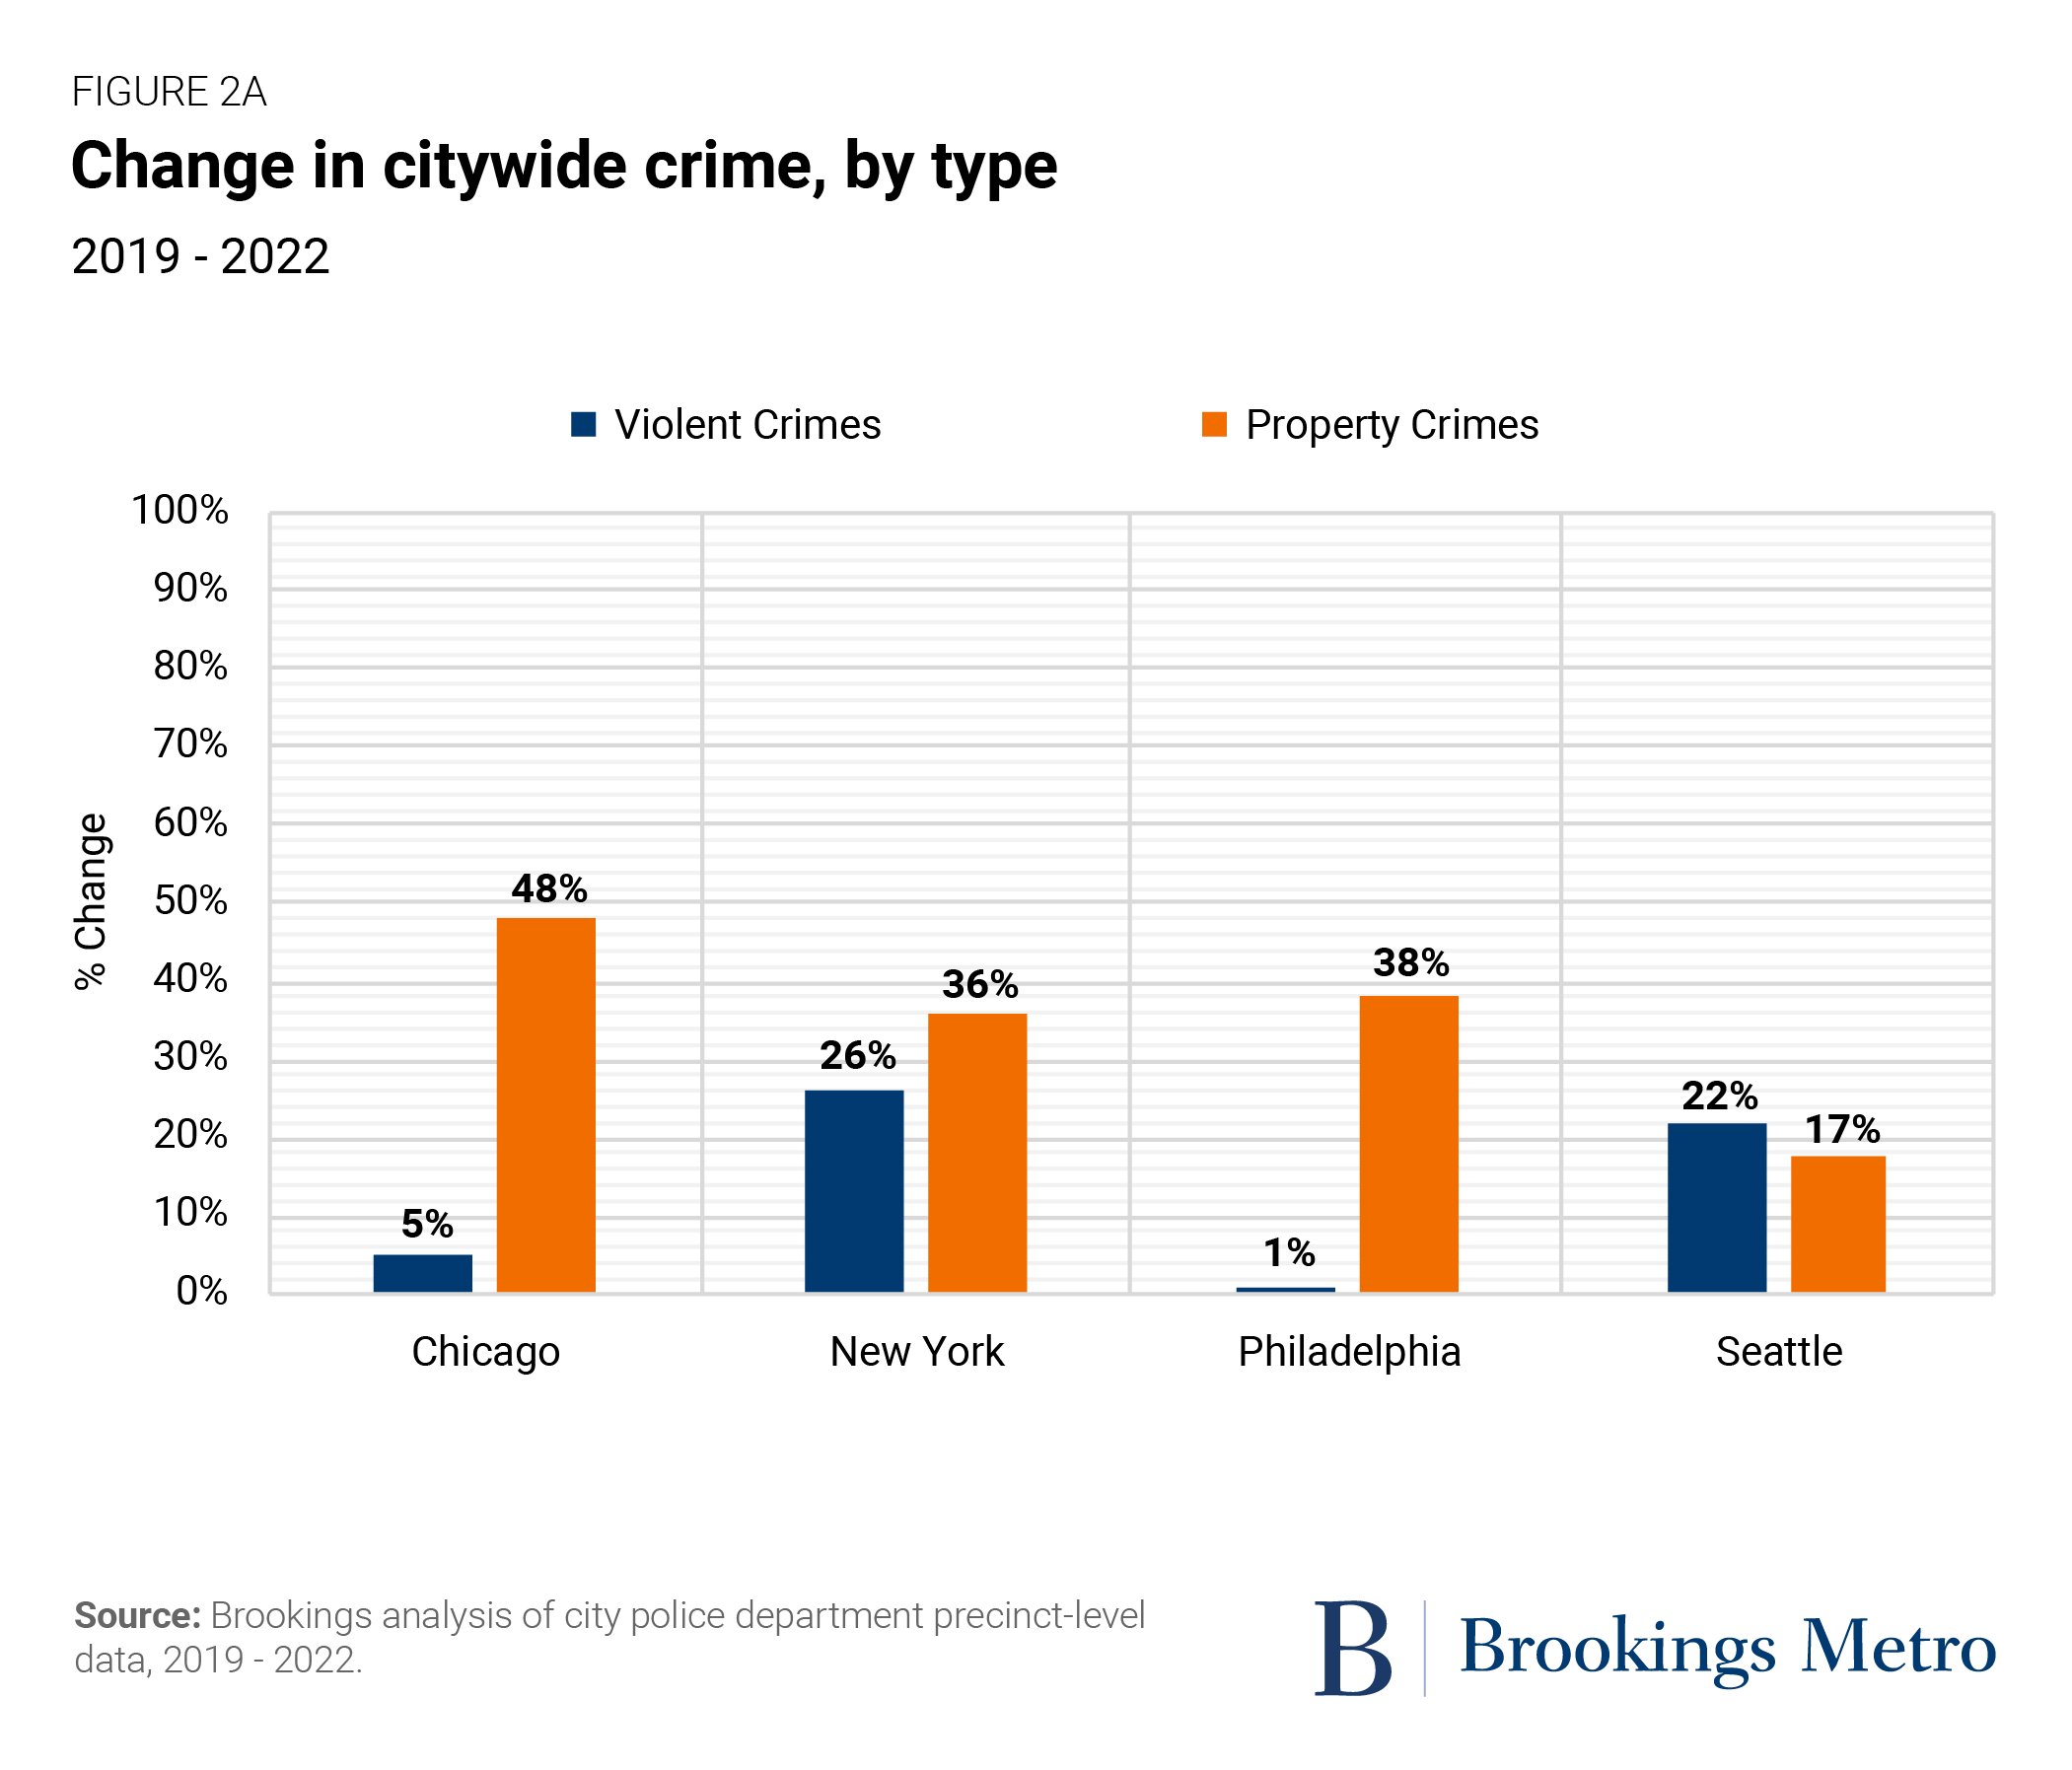
Citywide crime increased between 2019 and 2022, driven primarily by property crimes—but downtowns accounted for a very small share of these increases.
As shown in Figure 2a, between 2019 and 2022, there was a 48% increase in property crimes in Chicago; a 38% increase in Philadelphia; a 36% increase in New York; and a 17% increase in Seattle. For violent crime, there was a 5% increase in Chicago; 1% increase in Philadelphia; 26% increase in New York; and a 22% increase in Seattle.
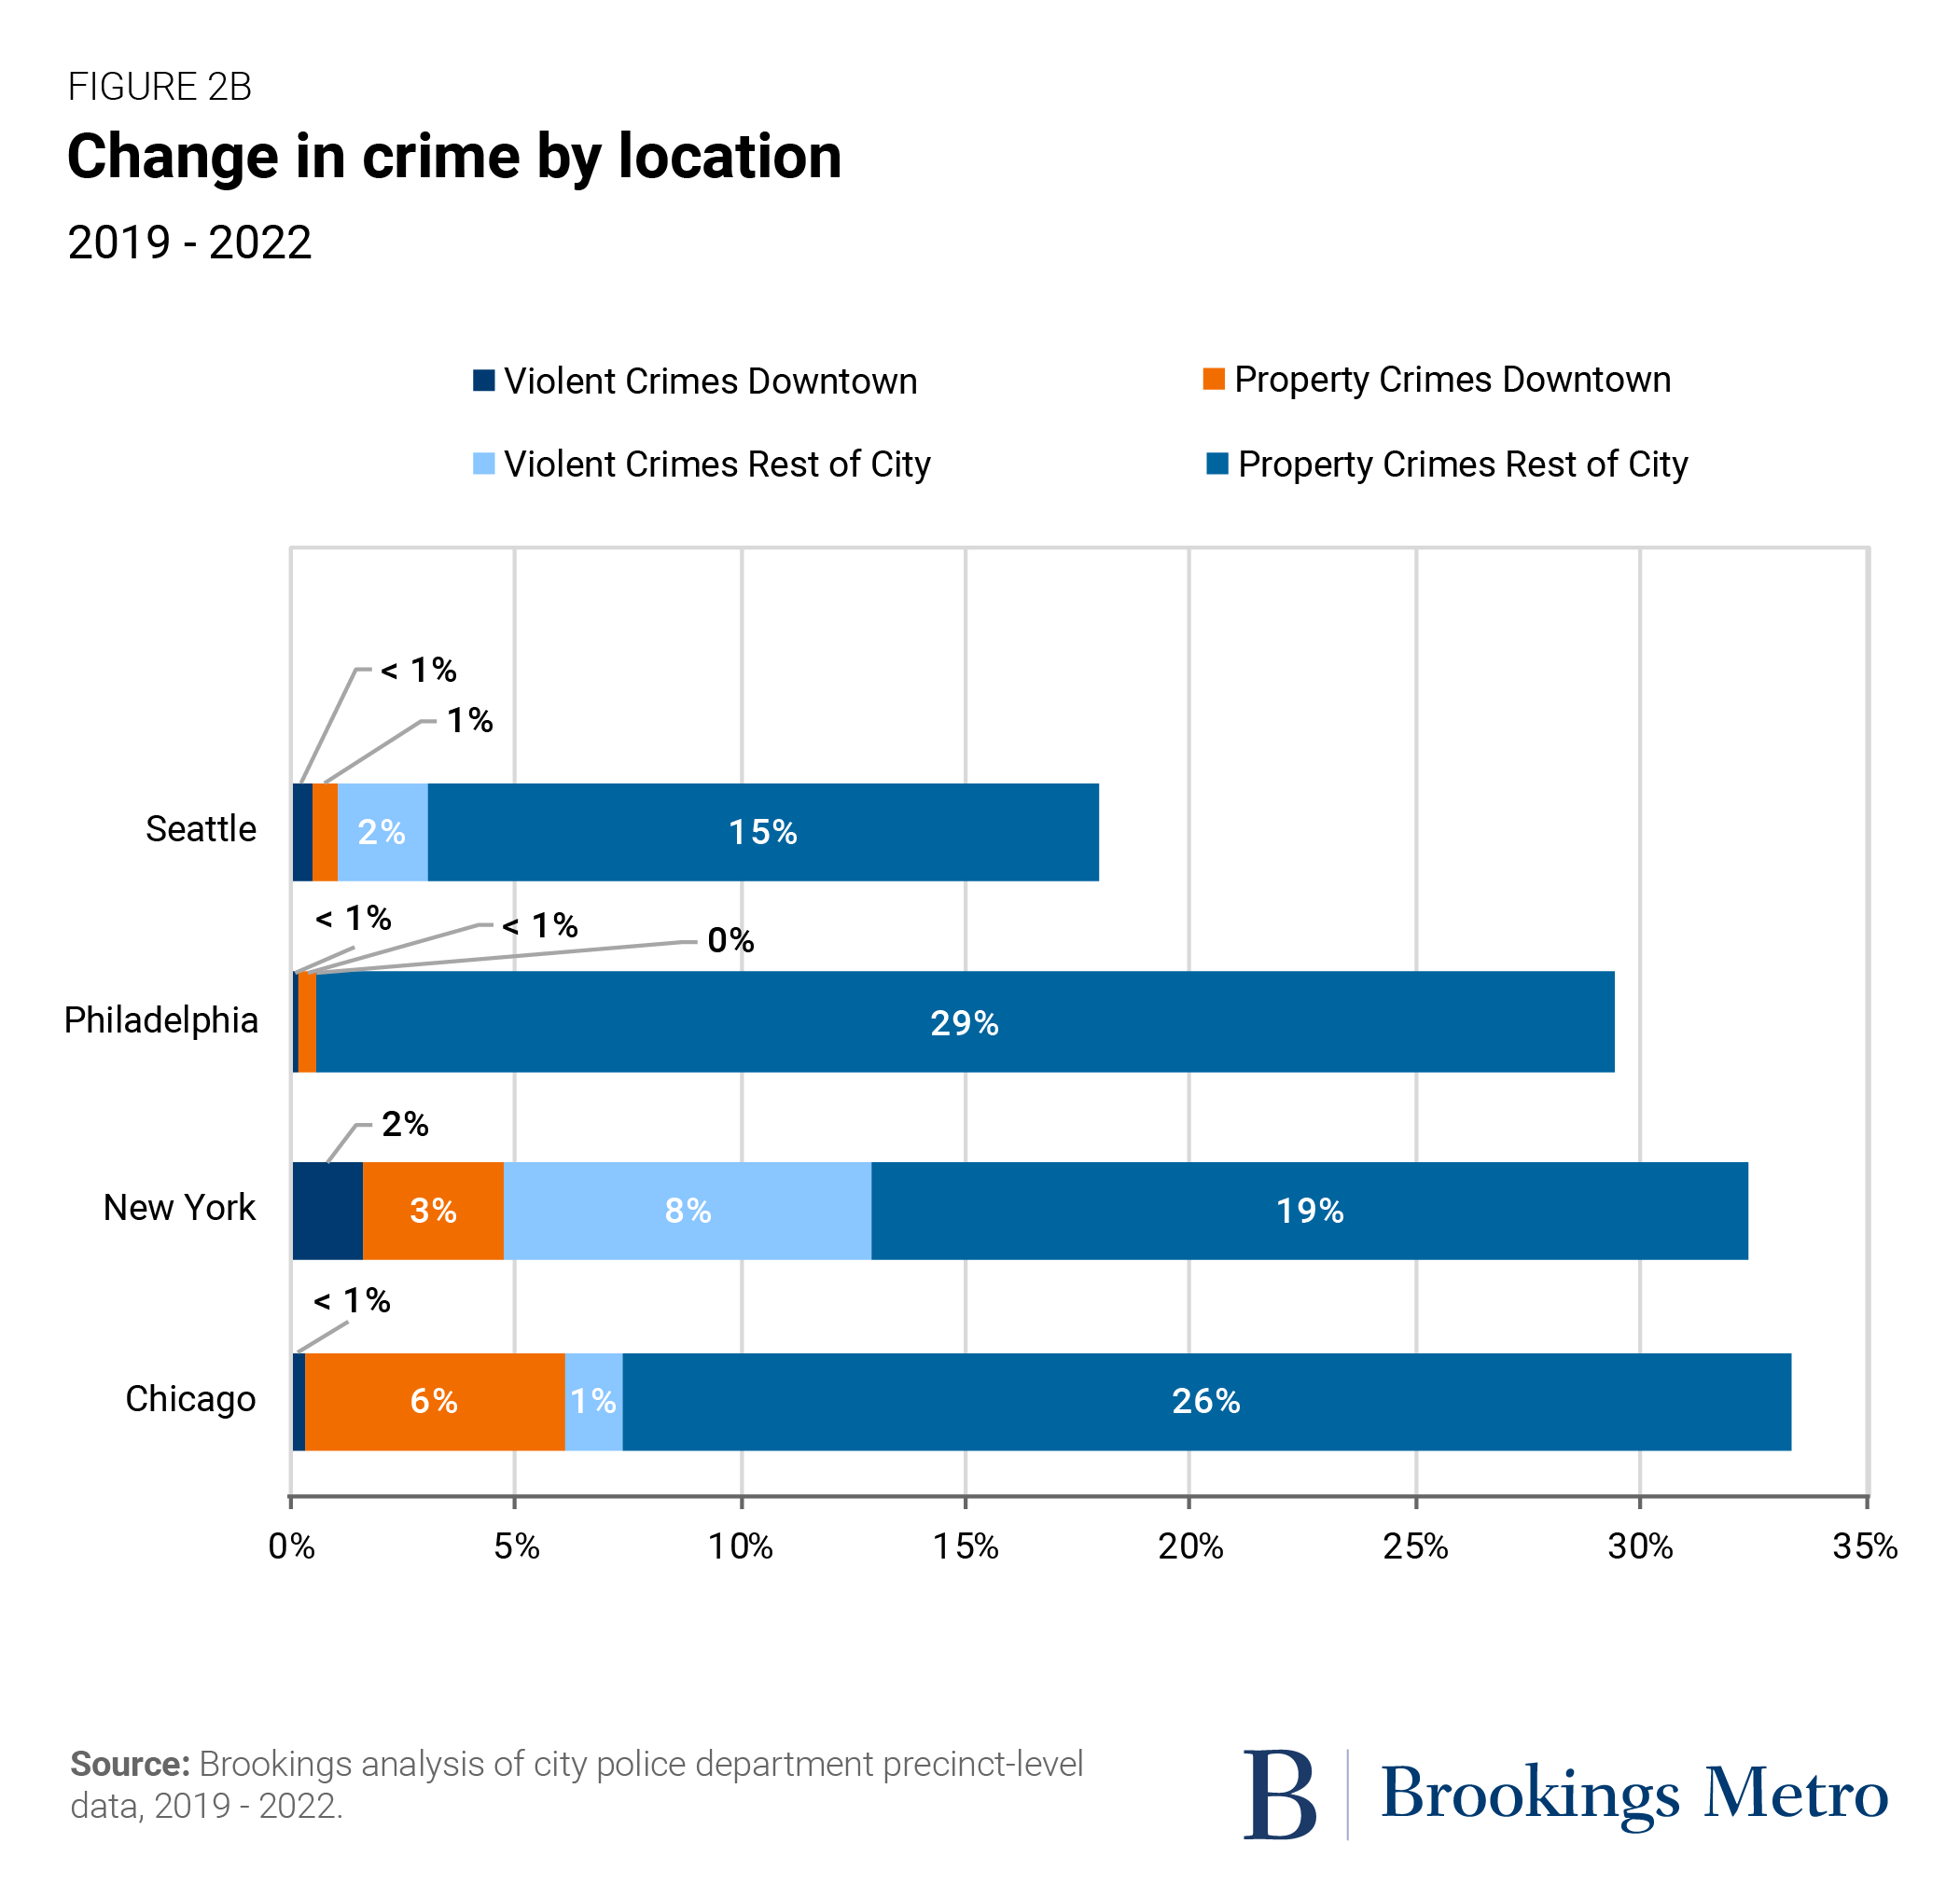
However, as shown in Figure 2b, downtown Chicago accounted for just 6% of the citywide increase in property crime and less than 1% of the citywide increase in violent crime. Manhattan’s core drove 3% of the citywide increase in property crime and 2% of the increase in violent crime. Downtown Seattle accounted for less than 1% of the city’s increase in violent crime and 1% of the increase in property crime. And Center City Philadelphia accounted for less than 1% of the increase in both categories.
Of course, there is still much work to be done to make Chicago a safer city for all, and it's important to not let negative media take control of this narrative. Read the full study by The Brookings Institution here.